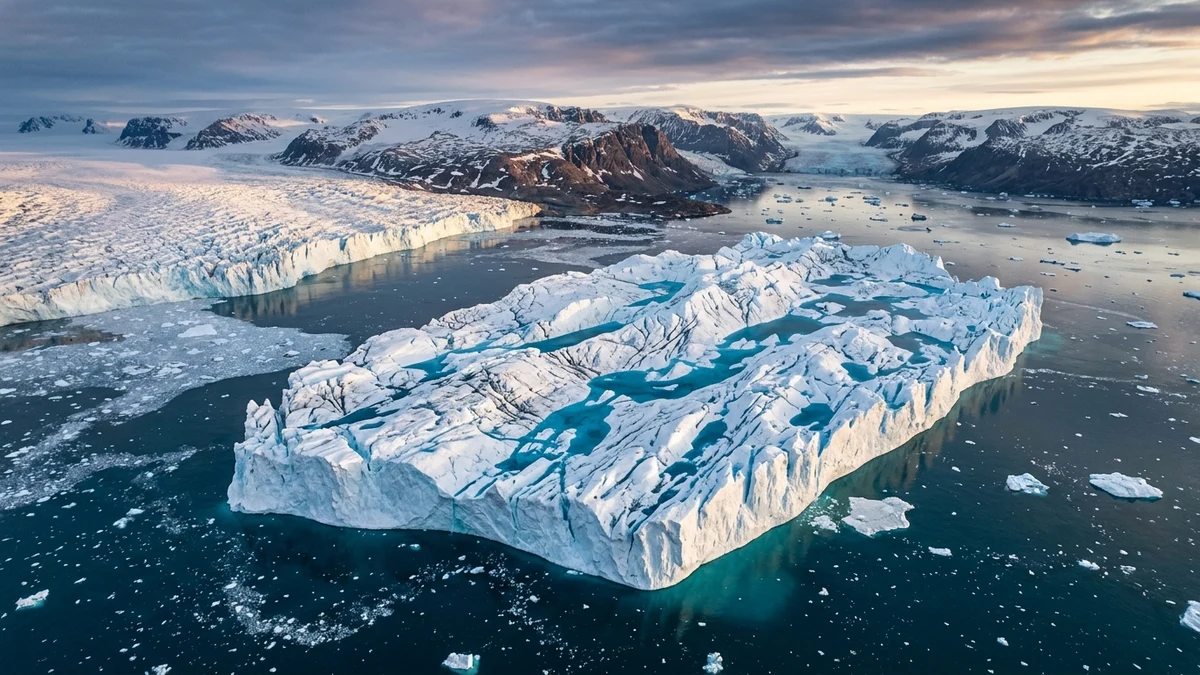
Earth-observation radar satellites operated by the European Space Agency (ESA) and NASA documented in August 2026 a colossal glaciological calving event in far northern Greenland: the detachment of a massive "ice island" spanning over sixty square kilometers from the floating ice tongue of Petermann Glacier. The gargantuan slab of glacial ice, roughly equivalent to the land area of Manhattan with a thickness exceeding one hundred meters, sheared free following rapid rift propagation driven by the intrusion of warm sub-surface North Atlantic ocean currents. The event has mobilized international polar research teams evaluating accelerating global sea-level rise projections.
Petermann Glacier represents one of the largest and most critical marine-terminating ice streams draining the Greenland ice sheet, functioning as a structural dam that throttles the seaward velocity of interior continental glaciers. High-resolution synthetic aperture radar (SAR) imagery and oceanographic bathymetry revealed that calving was not merely triggered by atmospheric surface melt, but by subglacial plumes of relatively warm seawater carving deep cavities into the glacier's submerged underside. This thermal undercutting forced the glacier's grounding line to retreat landward by several kilometers, fatally destabilizing the ice tongue.
This massive calving event serves as a stark validation of dynamic ice-ocean interaction models, showing that basal melting processes occur at speeds exceeding previous climate projections. As the colossal ice island drifts toward Nares Strait, specialized glaciological sensor packages mounted on the iceberg are providing real-time telemetry on melt rates and freshwater flux, yielding crucial data regarding how freshwater discharge influences the Atlantic Meridional Overturning Circulation (AMOC).
Glaciological Comparison: Historical Calving Benchmarks at Petermann Glacier
Petermann Glacier possesses a documented chronology of major structural calving events that reshaped northern Greenland's marine margins over the past two decades. To understand the structural implications of the August 2026 event, we must evaluate its physical dimensions and underlying drivers against historical benchmark calvings in 2010 and 2012. The latest telemetry confirms that basal melt rates have accelerated due to shifting polar ocean currents.
| Calving Event | 2010 Calving Benchmark | 2012 Calving Benchmark | August 2026 Ice Island Detachment |
|---|---|---|---|
| Calved Ice Area | ~250 km² (historical record calving) | ~130 km² (secondary structural failure) | ~60 km² (Manhattan-scale ice slab) |
| Average Ice Thickness | ~160 to 200 meters | ~120 to 150 meters | ~100 to 130 meters with deep basal incision channels |
| Primary Failure Driver | Transverse rift propagation across ice tongue | Dynamic tidal stresses on thinned margin | Sub-surface warm ocean water cavity intrusion at grounding line |
| Inland Glacial Impact | Moderate acceleration of upstream ice flow | Progressive loss of lateral fjord buttressing | Permanent ungrounding and loss of structural resistance |
During low-altitude aerial surveying flights equipped with ultra-wideband ice-penetrating radar, glaciologists observed brilliant turquoise supraglacial meltwater lakes and deep crevasses incising the surface, while oceanographic gliders measured water temperatures two degrees Celsius above baseline flowing beneath the fjord. These internal channels hasten mechanical disintegration by exerting hydrostatic pressure along vertical shear margins.
Beyond contributing to long-term sea-level rise, the migration of this massive tabular iceberg through Arctic maritime corridors necessitates 24/7 radar tracking by the International Ice Patrol to protect scientific vessels and shipping lanes navigating northern Baffin Bay.
Satellite Remote Sensing and Global Sea-Level Trajectories
The progressive collapse of Greenland's marine-terminating ice shelves highlights the urgent necessity of assimilating real-time satellite remote sensing into Intergovernmental Panel on Climate Change (IPCC) predictive sea-level rise frameworks. When protective floating ice tongues calve, upstream continental ice accelerates its transit into the ocean, transferring billions of tons of grounded mass into global waterways.
Polar research institutes in Denmark, Germany, and the United States are currently utilizing artificial intelligence models to predict micro-fracture propagation along the glacier months ahead of visual rifting, mapping critical shear stresses along bedrock boundaries. This spaceborne vigilance provides coastal municipalities worldwide with higher-precision data to engineer coastal defense infrastructure.
The calving of the Petermann Glacier ice island stands as a vivid, undeniable testament to the vulnerability of our planet's polar ice reservoirs. By documenting the rapid transformation of the Arctic landscape, science delivers the empirical evidence required to understand and protect Earth's climate stability.
Frequently Asked Questions
What is the scale of the ice island that broke free in Greenland?
The detached iceberg spans over 60 square kilometers with a thickness of roughly 100 meters, representing a land area comparable to the island of Manhattan.
Why is Petermann Glacier so critical for the global climate?
Because it acts as a structural plug restraining inland continental ice; when the floating shelf disintegrates, grounded glaciers flow faster into the sea, accelerating global sea-level rise.
What triggered the ice detachment in August 2026?
Oceanographic research confirmed that warm sub-surface ocean currents penetrated beneath the floating tongue, eroding the ice from underneath and triggering deep vertical rifts.
Official Scientific References
- European Space Agency (ESA) Earth Observation — Sentinel satellite radar imagery and Petermann Glacier calving monitoring.
- National Snow and Ice Data Center (NSIDC) — Arctic ice shelf mass balance and glaciological telemetry reports.
- Nature Climate Change — Peer-reviewed studies on subglacial ocean cavities and marine-terminating glacier dynamics in Greenland.